This site is optimized for desktop. Some charts and tables may not display properly on mobile devices.

Data Driven Emotion Free
Gain powerful, independent insights. Kickstart your retirement portfolio with one of our buy and hold stock recommendation, and unlock Premium Plans to accelerate your portfolio growth
Historical Performance of the Alpha Edge Stock Ranking — one of our Buy & Hold subscription plans
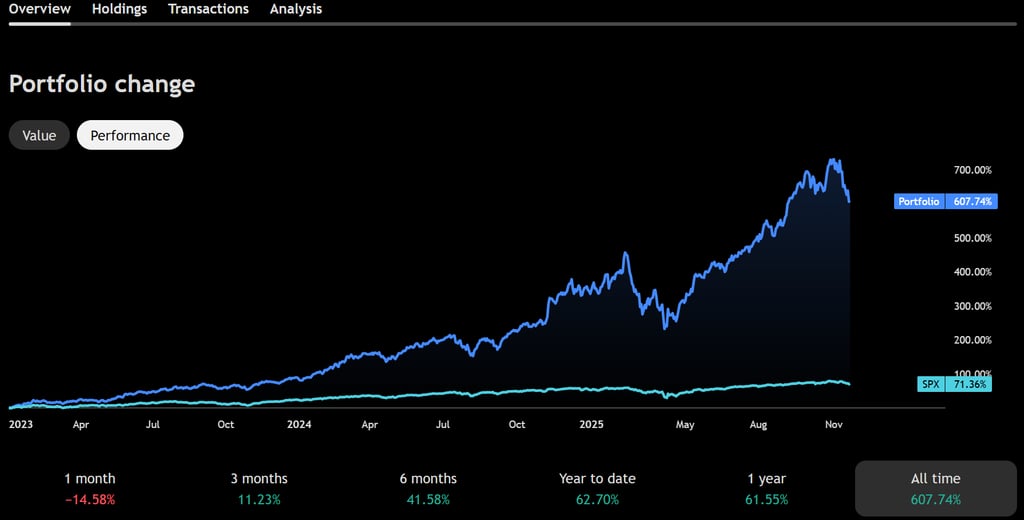
All performance shown is based on a TradingView model portfolio and does not represent an actual client account. Alpha Edge is included in our Buy & Hold subscription plans.
Past performance is not a guarantee of future results. Market conditions can change, and future returns may differ significantly from historical outcomes.


Alpha Edge: Top 5 Stocks and Their Returns
This chart shows the historical performance (January 1, 2023 to the present) of a sample of 10 stocks from our Alpha Edge stock ranking, included with the Alpha Edge Buy & Hold subscription plan. While these stocks remain in the portfolio, we rotate holdings whenever our analysis indicates they have become overvalued—even within our long-term Buy & Hold strategy. As a result, any of these stocks may be removed from our recommendation list at any time, with clients notified promptly. With the rapid pace of technological and economic disruption, there are very few stocks that can truly be considered “buy and hold forever.”
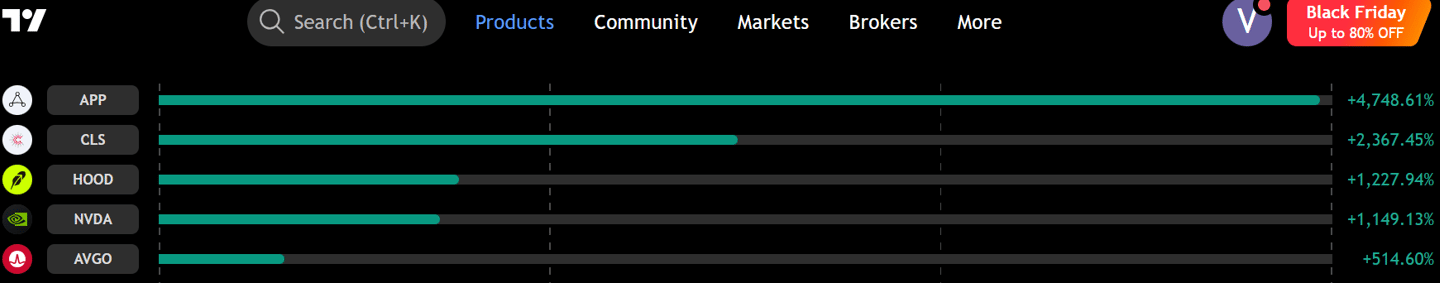
Just a few of the 100+ stocks we handpicked through rigorous, data-driven analysis
Disclaimer
All performance shown is based on a TradingView model portfolio and does not represent an actual client account. Past performance is not a guarantee of future results. Market conditions can change, and future returns may differ significantly from historical outcomes.
The results are provided for informational purposes only. Nothing in this presentation should be considered investment advice. Please conduct your own due diligence before purchasing any of these or other securities.
Start investing with us today—your future self will thank you in five years.
Each month, we publish a curated selection of stocks backed by deep, multi-layer analysis.
Our newsletter provides research and insights — not individualized investment recommendations.


Passive Subscription Plan
Seeking reliable long-term investment ideas? Join our Essential Tier Plans and access expertly selected dividend, value, and growth stocks — curated to match your strategy.
Active Subscription Plan
Want to take a more active approach to investing? Join our Active Management Tier and access expert-driven stock rotations, real-time alerts, and adaptive strategies designed to capture market opportunities.
Investment Insights
Only stocks that pass our stringent analytical process are shared with our subscribers.
Stock Recommendations
Receive one meticulously researched stock recommendation each month to enhance your portfolio with our free plan


AI Scanners
Our proprietary AI scanners identify stocks with the highest potential, and our unique research strategy filters them down to the very best
We evaluate each opportunity from company-specific, industry, and macroeconomic perspectives, followed by proprietary quantitative testing
Rigorous Evaluation


Our Analysis Process
We identify high-potential stocks using a rigorous, multi-stage strategy that filters opportunities through increasingly stringent criteria


Your Edge through Multi-Layer Analysis
AI Filtering: Our proprietary scanners source an initial batch of high-potential stocks.
Holistic Scrutiny: Each company undergoes fundamental, industry, and macroeconomic analysis.
Algorithmic Testing: Prospects are validated by our proprietary quantitative models.
Final Selection: We only share the elite stocks that pass all stages, delivering quality over quantity.
AI Screener, what is behind the fancy word?
Our AI is built on a foundation of deep learning models, continuously trained on millions of data points—from traditional fundamentals to real-time news sentiment. We don't just filter stocks; we teach our AI to understand the underlying drivers of value and growth, empowering you with institutional-grade analysis.


How did we train the AI model?
We used:
Gradient Boosting Machines (XGBoost, LightGBM) as a starting point for tabular numerical data (like P/E ratios and moving averages).
Recurrent Neural Networks (RNNs/LSTMs) for time-series data (like sequential stock prices).
Transformers (BERT, etc.): for understanding text and language (for the news/sentiment analysis part).
We then split the data into two. We fed 80% of the training data and the model constantly adjusted its internal parameters to minimize its prediction error.
Once trained we used the 20% on the Test Set (data it has never seen during training) and evaluated the result. After 10 months of continuous training and back testing we finally achieved our objective and packaged the model into an API.
We didn’t stop there.
An AI trained on 2020-2024 data, for example, may not work in 2025. So, we are continuously:
Monitor its performance for degradation.
Feed it new data.
Periodically retrain it to adapt to new market environment.
How did we create an AI Stock Screener and what is it?
We trained an AI model and packaged into an API. When we screen for a stock, we enter a query (different for passive and active portfolio management) to this API, which returns the AI's prediction or screen result.
Powerful Asset Filtering & Discovery
Scroll down to explore a stock screener powered by the same live data that feeds our proprietary API. While this tool isn't powered by AI unlike our API and is manual, it puts the power of discovery in your hands. Effortlessly filter thousands of global assets using a comprehensive set of institutional-grade criteria to pinpoint the exact opportunities that match your unique strategy.
Filter by Core Metadata
Symbol Type: ETFs, Forex Pairs, Cryptocurrencies, Indices, or Futures.
Exchange: e.g., NASDAQ, NYSE, TSX, LSE, BINANCE).
Country: US, Canada, etc.
Sector & Industry: Drill down into specific market segments, such as Technology, Healthcare or Energy
Filter by Fundamental Data
Valuation Metrics: Screen by P/E Ratio, P/B Ratio, EPS, and Market Capitalization.
Growth & Profitability
Liquidity and Financial Stabilty
Dividend Information
Price Performance: Top Gainers or YTD performance, etc.
Momentum: Use indicators like RSI to find oversold (<30) or overbought (>70) conditions, or look for bullish/bearish crossovers with the MACD.
Volatility: Find assets breaking out of consolidation or trading near volatility bands using tools like Bollinger Bands.
Filter by Technical Analysis Indicators
Stock Screener
We empower you with the knowledge to make informed decisions for life
Great investing isn't just about picks—it's about understanding the why.
Check Our Blog where you will find tons of educational and useful information and also subscribe to our free newsletter.


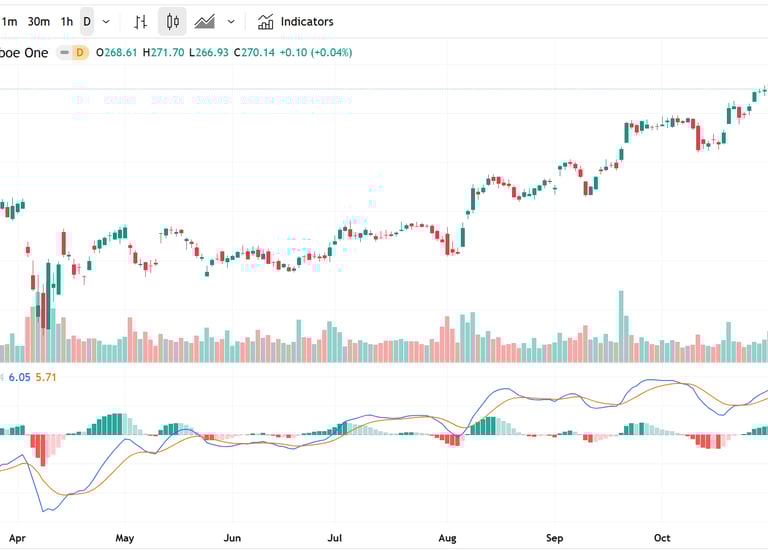
📊 Real-Time Market Charts
Explore live charts powered by TradingView on our Investor Tools page — track any stock or asset, switch between chart types, add professional indicators, and perform real-time technical analysis. Use the same tools professionals rely on — and the ones we recommend after testing them all.
Investor Tools
Free Essential Market Overview and Screening Tools
Real Time Charts
Advanced market analysis tool.
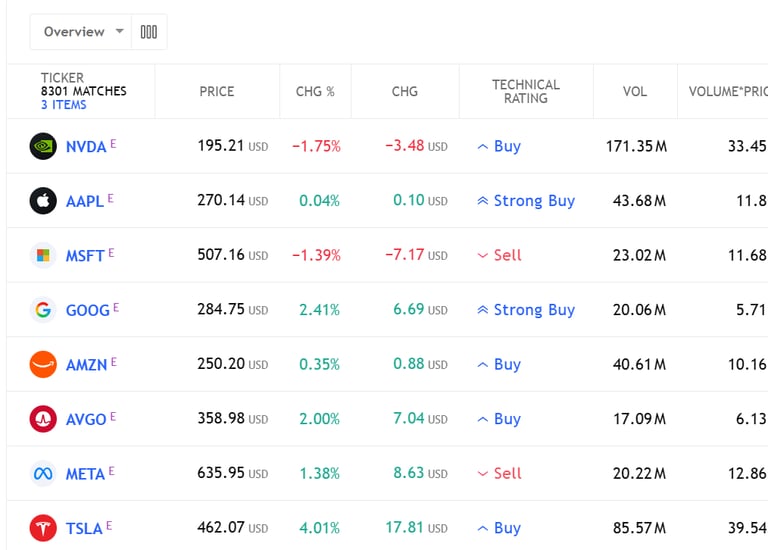
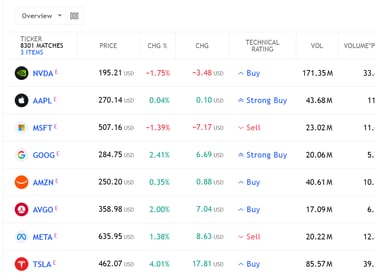
Real Time Stock Screener
Real-time data visualization.


Market Overview
See the top five gaining, losing, and most active stocks for the day
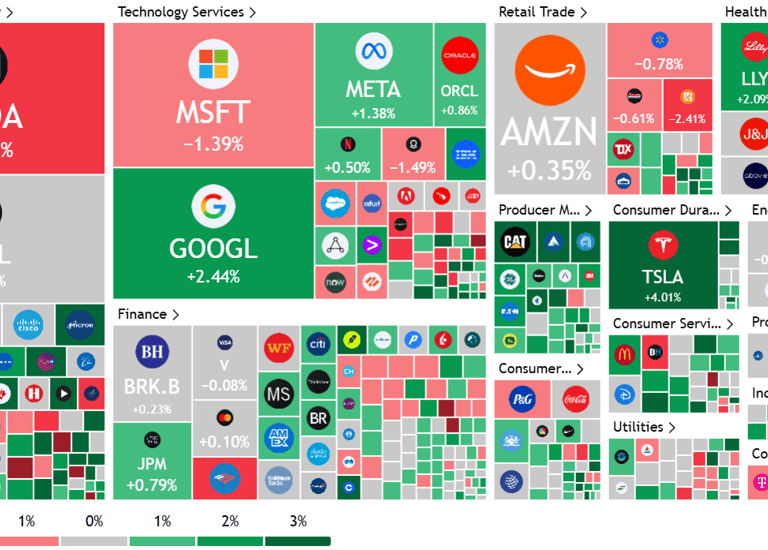
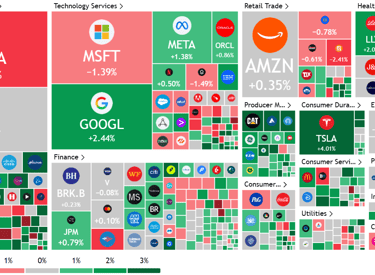
Stock and Crypto Heat Maps
Efficient portfolio tracker.
Stay up to date with finance market news

